Dashboard Overview
How to read the Attribution screen in 60 seconds.
On this page
Your dashboard answers one question: did this pay for itself? Everything on the screen ties back to appointments that were booked and actually happened — never to projections or estimates.
It’s called Attribution in the left menu, because that’s what it does — it attributes real money to the calls your receptionist answered.
Activity reports don't pay wages
Most answering services report activity: calls handled, minutes used, messages taken. None of that tells you whether you made money. This screen starts from the other end — the appointments that held, and works backwards to the calls that created them.
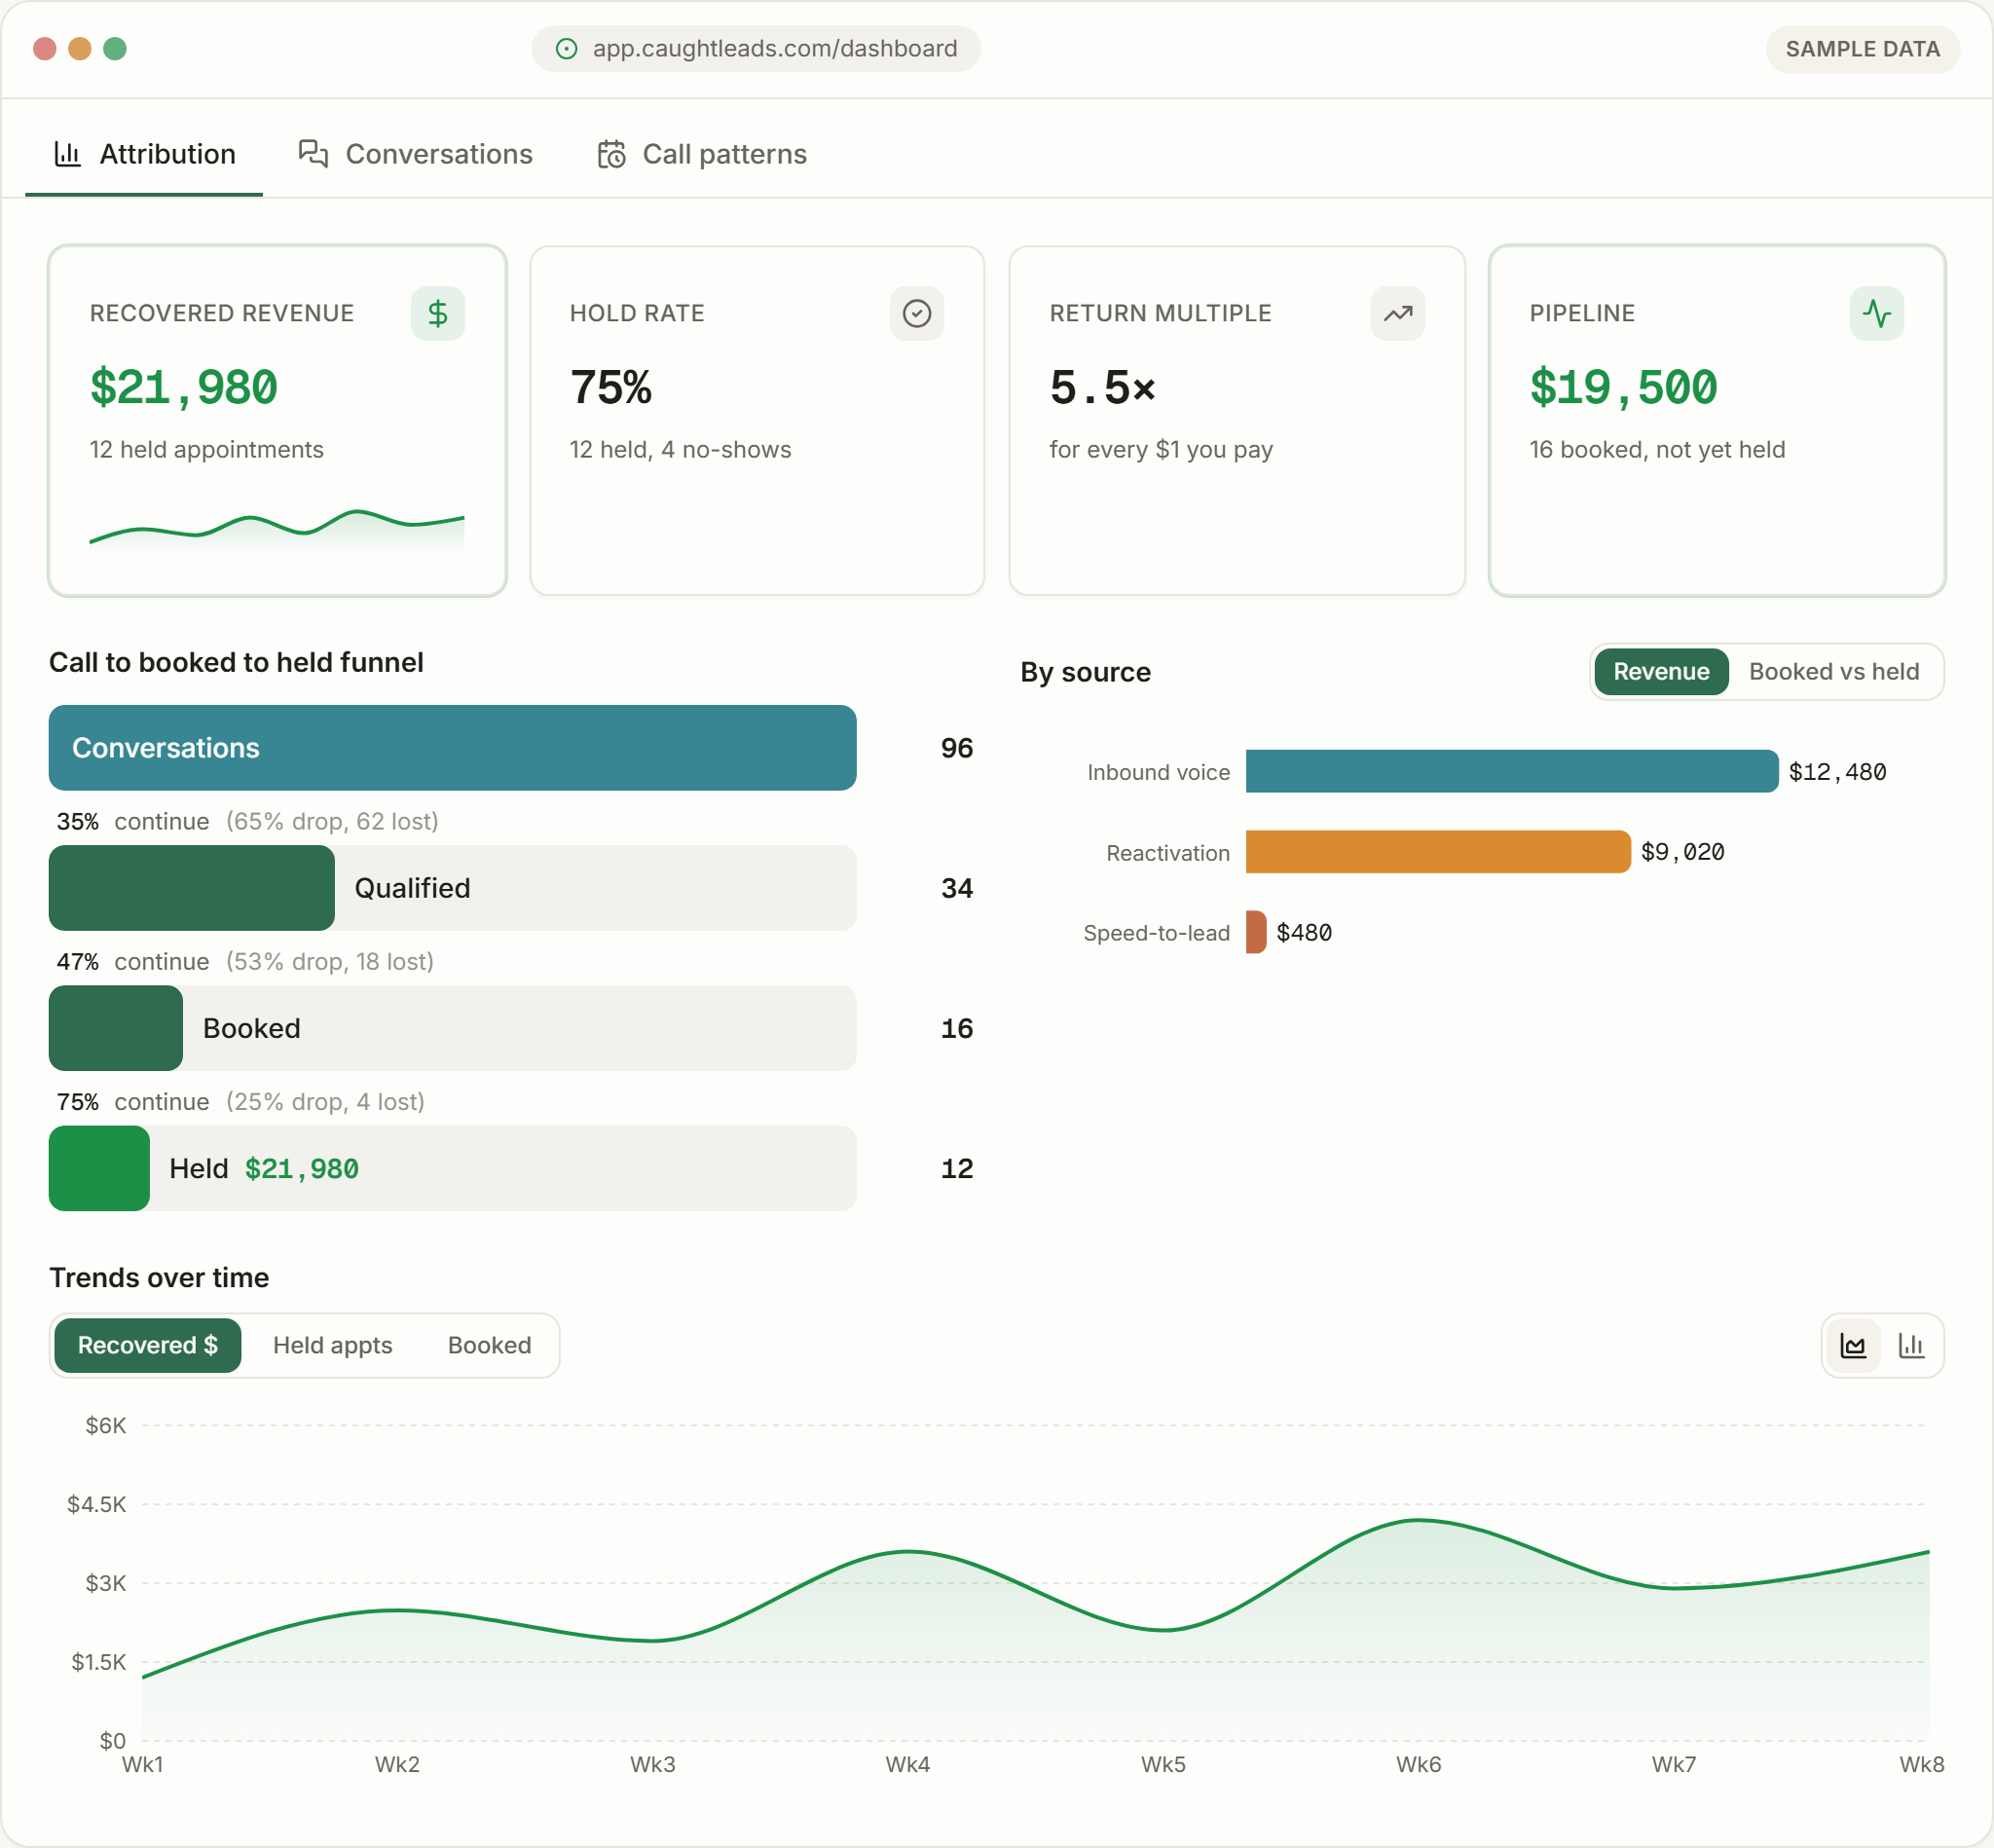
The four numbers at the top
- Recovered revenue
- The closed value of every appointment we booked that you actually kept. This is the headline, and it's shown in money-green because it's real dollars.
- Return multiple
- What you got back for every $1 you paid this month. A 4.2× means $4.20 of held work for each dollar of fee.
- Hold rate
- Of the appointments booked, the share that actually happened. Shown against a 60% target.
- Pipeline
- Value that's booked but hasn't happened yet. It moves into recovered revenue as those appointments hold.
Pipeline is not revenue
The funnel underneath
Below the four tiles is the funnel — every stage a lead passes through, with the drop between each one.
- Conversations
- Every call and text your receptionist handled.
- Qualified
- The ones that were real work you take, not wrong numbers, not sales calls, not jobs outside your area.
- Booked
- An appointment went onto your calendar.
- Held (showed)
- The appointment actually happened. This is the stage that carries the money.
The percentage between two stages is where you look when something feels off. A healthy business loses people at every stage — the question is whether one drop is much bigger than the others.
How to read it in 60 seconds
- 1
Look at recovered revenue first
If it comfortably beats your monthly fee, the rest is tuning.
- 2
Check the return multiple
Anything above 3× is working. Below 2× means either volume is low or something is leaking in the funnel.
- 3
Find the biggest drop in the funnel
Conversations → Qualified tells you about lead quality. Qualified → Booked tells you about your receptionist. Booked → Held tells you about no-shows.
- 4
Open one call from that stage
Click through to Conversations and read the transcript. Numbers point at the problem; the call itself explains it.
Choosing a date range
The range picker at the top right changes every number on the screen. A few things worth knowing:
- Short ranges are noisy. One big job can double a week's recovered revenue.
- A month is the honest unit — it matches how you're billed and how appointments hold.
- Recent bookings that haven't happened yet sit in pipeline, not revenue, so a range ending today will always look lighter than it will in two weeks.
A typical month
Recovered revenue counts the value of held appointments as they were booked. If a technician upsells on site, or a job is rescheduled into next month, your books and this screen will differ. This screen is a measure of what the phone brought in, not a replacement for your invoicing.